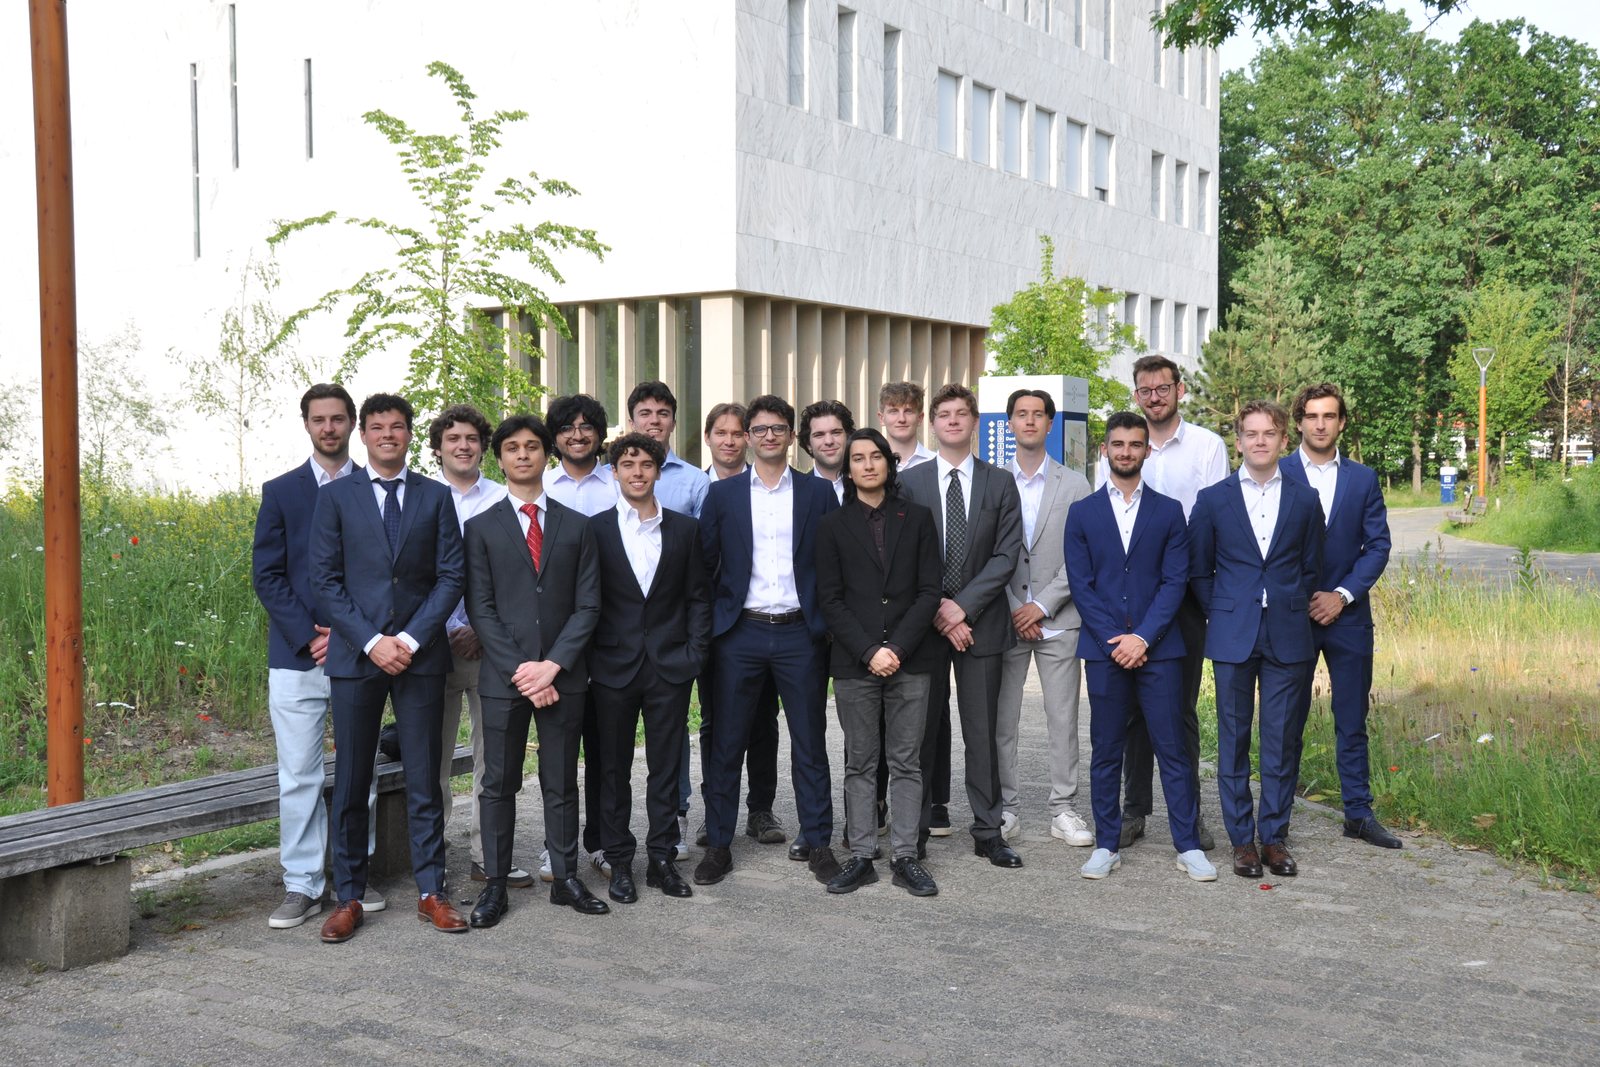
Combining statistical modelling, machine learning, and rigorous risk management to develop systematic approaches to financial markets.

The Quantitative Investment department is TIC's hub for data-driven finance. We bring together students passionate about mathematics, statistics, and programming to develop systematic investment strategies.
Our department operates through two specialized teams - the Risk Management Team and the Quantitative Research Team - each bringing a unique perspective to how we approach financial markets.
Members gain hands-on experience with Python, R, and industry-standard tools while working on real-world projects ranging from portfolio optimization to algorithmic trading strategies.

Each team brings specialized expertise to build robust, data-driven investment strategies.
Identifying, measuring, and mitigating financial risks through quantitative frameworks and stress testing methodologies.
Developing and backtesting systematic trading strategies using statistical models, machine learning, and alternative data.
Six areas every quant member works through — the concept, the mathematics, and the code we actually run.
Build quantitative models using pandas, NumPy, scikit-learn and industry libraries. Python for day-to-day research, R for deeper statistical work.
Rolling volatility
In practice
import pandas as pd, numpy as np returns = prices.pct_change().dropna() vol_21d = returns.rolling(21).std() * np.sqrt(252) # 21 trading days ~ 1 month, annualised
Used for Every price series in the portfolio runs through this.
Regression, hypothesis testing, time-series analysis and stochastic calculus. We test assumptions — normality, stationarity, autocorrelation — before acting on a signal.
Beta, market sensitivity
In practice
import statsmodels.api as sm X = sm.add_constant(mkt_returns) model = sm.OLS(stock_returns, X).fit() beta = model.params['mkt'] # t-stat in .tvalues
Used for Feeds the beta column on the risk tearsheet.
Supervised and unsupervised learning applied to financial data. Random forests, gradient boosting and neural networks — with heavy emphasis on walk-forward validation to avoid look-ahead bias.
Logistic classifier
In practice
from sklearn.ensemble import GradientBoostingClassifier # walk-forward: train on the past only for train, test in TimeSeriesSplit(5).split(X): clf.fit(X[train], y[train])
Used for The LSTM leg of our monthly pipeline runs on this.
VaR, CVaR, stress testing and modern risk frameworks. We run parametric VaR, historical simulation and Monte Carlo; CVaR captures the tail risk that VaR ignores.
Value at Risk & expected shortfall
In practice
from scipy.stats import norm z = norm.ppf(0.05) var_95 = -z * sigma * portfolio_value cvar = losses[losses >= var_95].mean()
Used for Both reports feed the quarterly risk review.
From Markowitz to Hierarchical Risk Parity — the mathematics behind allocation. We backtest each approach against simpler benchmarks like equal weight.
Mean–variance objective
In practice
from scipy.optimize import minimize obj = lambda w: -(w @ mu - lam/2 * w @ cov @ w) cons = ({'type': 'eq', 'fun': lambda w: w.sum() - 1},)
Used for Sets the target weights the club votes on.
ARIMA, GARCH and the stochastic models underpinning pricing and volatility work. We rarely implement Black–Scholes directly, but understanding GBM is prerequisite to serious quant work.
GARCH(1,1) and geometric Brownian motion
In practice
from arch import arch_model res = arch_model(returns, vol='GARCH', p=1, q=1).fit(disp='off') forecast = res.forecast(horizon=21)
Used for Drives the volatility forecast in the risk module.
Every project follows a structured research process grounded in the scientific method.
Identify market anomalies, review academic literature, and form testable investment hypotheses.
Gather and clean financial data, then build quantitative models and algorithms in Python or R.
Rigorously test strategies against historical data, analyze performance metrics, and manage risk.
Present findings to the department, receive peer feedback, and iterate on strategy refinement.
Recent work from our quantitative research and risk management teams.
Using reinforcement learning to dynamically rebalance portfolios based on market regimes.
Building a comprehensive framework for extreme scenario analysis in equity portfolios.
Evaluating value, momentum, and quality factors across European equities.
Illustrative growth of our Quant portfolio since inception. Members see live numbers in the portal.
Base 100 at inception · illustrative
Whether you're into data science, mathematics, or simply curious about quant finance - there's a place for you in our team.